|
|
This website is better viewed at 1024 x 768 resolution. |
|
|


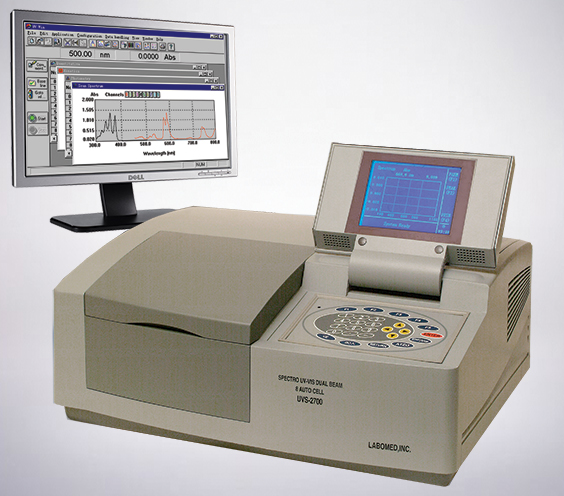
Spectro UV-Vis Dual Beam
PC
Scanning Spectrophotometer
UV-VIS Split Beam8 Auto Cell
Model
UVS-2700 & UVS-2800
Spectro UV-Vis Split
Beam PC is a precise
scanning
Spectrophotometer with a new design of 8 microprocessor automatic 2 row
cell holder that moves noiseless with a special membrane. This Split
Beam Spectro has a dual detector and a very accurate system.
Spectro UV-Vis
Split
Beam PC is
microcomputer-controlled and has a large LCD display to work
independently. It can also be linked to a computer and a printer to
show Photometric and Spectral data in the PC monitor. This connection
is controlled by the RS232 AND USB interface, compatible with Windows
XP, & and 8, using the new UVWin 6.0 UV-VIS application software.
Spectro UV-Vis
Split
Beam PC is also capable
of
performing kinetic test by an optional Peltier constant temperature
system, and can test flow through liquid by the optional Sipper Flow
Through System.
Spectro UV-Vis
Split
Beam PC can be used as
an
accurate system for qualitative and quantitative analysis of analytical
test, Biochemistry, Chemistry, Clinical Analysis, Pharmaceutical and
Agriculture Labs, Quality control, Industry and research.
Spectro UV-Vis
Split
Beam PC can perform
protein, nucleic acid, DNA/RNA
micro and macro measurements, that can also be printed using an external HP 600/800
series printer or a PC printer.
There are 2
models of Spectro UV-Vis Split
Beam PC available:
1)
Spectro
UV-Vis Split
Beam PC with fixed
bandwidth
of 1 nm (UVS-2700).
2)
Spectro
UV-Vis Split
Beam PC with variable
bandwidth of 0.5, 1.0, 2.0 and 5.0 nm. (UVS-2800) is also available.
This Spectro can be used by itself or linked to a PC and comes with a USB interface to connect to the computer.
The operation manual is available in 18 available different languages.
Features
Top of the Page
-
Baseline
Stability: The Split-beam
monitoring ratio system enhances baseline stability.
-
Excellent
Resolution: The big-caliber
light path enhances the instrument’s energy, reduces its
noise and raises its resolution performance.
-
Automatic
successive measurement: The
automatic eight-cell sample holder offers the automatic measurement of
eight samples in succession. So it can bring about one-touch
measurement of the solution of seven samples and a blank.
-
User-friendly
light source: The light source performs an automatic interchange, selectable within the working range of the light source. The socket
deuterium lamps and tungsten lamps facilitate light source replacement,
simplify maintenance and reduce operation error.
-
Convenient
Display: The large backlit
LCD screen displays both photometric values and spectral curves.
-
Full
use of Computer Technology:
Being computer controlled with compatible with Windows
XP, & and 8, using the new UVWin 6.0 UV-VIS application software, offering a wide range of uses and applications.
-
The
key components are all adopted from
the world famous manufacturer, such as deuterium lamp, silicon
photodiode and holographic grating, which ensures the stabilization and
credibility of the Instrument for extended life.
-
Computer
System is optional (NOT INCLUDED).
Functions
Top of the Page
- Photometric
Measurement: Rapid and
accurate measurements of transmittance and absorbance for samples and
selected wavelength are available.
- This module allows successive and automatic calibration and
measurement of up to seven samples with the built-in 8-cell sample
holder.
- Direct concentration results can be produced by simply entering the
K-factor.
- Printout of Measured data with sample numbers in a tabular format.
- Spectrum
Scan: Spectra of samples on
any range between 1100nm ~ 190 nm can be measured with real time visual
display of spectral curves on the large LCD screen.
- Such operating parameters can be selected, as photometric mode,
wavelength range, ordinate range, sampling interval and scanning speed.
- Picking out and printout of peaks and valleys for spectral curves.
- Printout of spectral curves to a printer with A4 paper.
- Quantitative
Measurement: Use a
calibration curve to determine the concentration of unknowns at the
user-selected wavelength.
- The regression of calibration curve can be made with up to 8
standards and the linear correlation coefficients be offered.
- The plot of a calibration curve is displayed on the large LCD screen.
- Instant concentration results can be produced by simply entering
K-factors.
- Successive and automatic calibration and concentration measurement up
to seven samples are available by the built-in 8 cell sample holder.
- Printout of the table of measured concentrations and K-factors of a
calibration curve.
- Windows
Software: Such operations
as photometry measurement, spectrum measurement, quantitation
measurement and kinetic measurement are offered in the UV-Win Windows
application.
- Up to 10 Spectra and time-course curves can be measured and recalled
in memory with data-handling of arithmetic calculation, logarithmic
calculation, reciprocal calculation, smooth, derivative (1t-4th), Abs
to/from %T conversion and peak pick.
- Up to 24 standards can be entered and measured for fitting of
calibration curve with order of 1st – 4th.
- With the Windows clipboard, the measured data and graphics can be
copied to other applications software for reports.
Software specifications
OUR NEW SOFTWARE UV-WIN 6.0
WITH 3D SPECTRA
Now all Labomed, Inc. split and double beam spectrophotometers with our newly developed software called UV-Win 6.0 can be used with Windows XP, Windows 7 and Windows 8. It is capable of testing more applications with its RS-232 and USB connections, and supports the data export of measured results to the PC and then flash drive, when additional data storage is required. One of the new features is that it provides 3-D graphing of the spectral results.
Top of the Page
MONOPROCESSOR
BUILT- IN APPLICATION
-
Photometric
Measurement: Measuring
transmittance or absorbance at the current wavelength together with K
factor calculations..
-
Spectrum
Scan: Carrying out scanning
of transmittance or absorbance on the selected wavelength range
together with peak-pick module.
- Quantitative
Determination: Regression
of standard curves and direct determination concentration of samples.
PC WINDOWS
APPLICATION SOFTWARE (RS-232 and USB INTERFACE)
- Photometric
Measurement: Measuring the
photometric values at 1-10 wavelengths together with mathematical
calculations according to entered quotations.
- Spectrum
Scan: Producing Wavelength
scans within the operating parameters on samples together with powerful
data handling facilities.
- Quantitative
Determination:
Determination of unknown concentration with methods of 1-3 wavelength
quantitation, together with fitting of calibration curve of 1st ~ 4th
order.
- Kinetics:
Recording curves of changing photometric values of samples against
timecourse at the selected wavelengths together with powerful data
handling facilities.
- Output:
With the Windows clipboard, the measured data and graphics can be
copied to other applications software for reports.
Accessories
Top of the Page
|
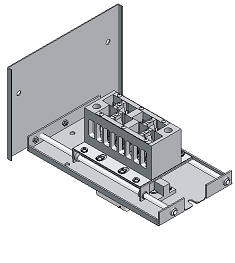 |
8 automatic cell holder |
|
-
1
PC cable
-
1
Software CD for Windows 98/2000/XP/7
-
1
Software Operation Manual available in 18 different languages
-
1
Spare Tungsten Halogen Lamp
-
1
Block Light Cell
-
1
Extra fuse
-
DVD of installation and how to use the Spectro
-
Optional: Peltier Kinetic Test System
-
Optional: Sipper Flow Through System
|
|
Technical
Specifications
Top of the Page
| 1)
Optical System: |
Dual
Beam (UVD-2700) and Split Beam (UVD-2800) |
| -
Wavelength Range: |
190
nm
– 1100 nm |
| -
Spectral Bandwidth: |
1.0
nm (UVS-2700) and 0.5, 1.0, 2.0 and 5.0 nm (4 steps) (UVS-2800) |
| - Wavelength Display: |
0.1 nm resolution |
| -
Stray
Light: |
≤0.12%T (220nm NaI, 340nm NaNO2) |
| -
Wavelength Accuracy: |
+0.3nm (with automatic wavelength correction) |
| -
Wavelength Reproducibility: |
+0.2
nm |
| 2) Photometric
System: |
Double Beam ratio monitoring system (UVD-2700)
The
split-beam monitoring ratio system (UVD-2800) |
| - Optical
System: |
The
crossed monochromator with the high-resolution, diffraction holographic
grating. |
| - Photometric
Method: |
Transmittance,
absorbance, energy and concentration |
| -
Photometric
Range: |
-0.3~3.0
Abs |
| -
Photometric
Accuracy: |
+0.002Abs
(0~0.5Abs)
+0.004Abs (0.5~1.0Abs)
+0.15%T (0~100%T) |
| - Photometric
Reproducibility: |
+0.001Abs
(0~0.5Abs)
+0.002Abs
(0.5~1.0Abs)
+0.15%T (0~100%T) |
| -
Baseline
Flatness: |
±0.002 Abs (200-1100nm) |
| -
Baseline
Stability: |
0.001Abs/30 min
(2 hours warming up, 2nm Bandwidth at 500nm) |
| -Scanning
Speed: |
1400nm/min or Selectable |
| -Interface
Card: |
RS-232 |
| -Detector:
|
Dual
Silicon photodiodes |
| -Photometric
Display: |
-9999
---- 9999 |
| -Photometric
Noise: |
±0.001Abs (500nm, 30 min warmup) |
| -Slew
rate of Wavelength: |
3600nm/min.
|
| -Standard Functionality |
Photometric, Quantitative, Spectrum and DNA measurements |
| 3)
DNA/RNA Measurement: |
|
| -
Results Printout. |
Printing
of measured data by using HP Deskjet 600/800 series (optional) |
| 4)
Mainframe: |
Compact
and standalone spectrophotometer mainframe |
| -
Light Source: |
Socket
Deuterium Lamp and Socket Tungsten Halogen Lamp.
- Detector: Silicon photodiode |
| -
Software Support: |
UVWin 6.0 |
| -
Display: |
Digital LCD Display |
| -
Sample Chamber: |
Automatic
eight-cell sample holder/changer |
| -
Size: |
22"x16"x10” |
| -
Weight: |
55
Lb. |
 |
|
ALSO AVAILABLE
Spectro UV-VIS Dual Beam PC (Model
UVS-2800)
Scanning
Spectrophotometer UV-VIS
Split Beam 8 Auto Cell
Variable Bandwidth
Bandwidth:
0.5, 1.0,
2.0
and 5 nm.
click here to fill out the Information Request Form

Labomed, Inc. Mailing Address: 2728 S La Cienega Blvd.
Los Angeles, CA 90034 U.S.A TEL (310) 202-0814 FAX (310) 202-7286
Copyright © 2019 Originally created in 2001
|